
Dashboard Overview w/ Metrics Breakdown
The Dashboard gives you a quick snapshot of your event activity, including setup warnings, fundraising progress, ticketing, donations, auction totals, item sales, and bidding activity. It is a helpful place to check the overall health of your event before, during, and after your auction.
Dashboard Warnings

- Warnings appear at the top of the Dashboard when something may need attention
- These may include:
- Auction items with $0 starting bids
- Auction items with $0 bid increments
- Auction items with $0 buy now prices
- Donor overpayments in ticketing/sponsorship sales
- Donor overpayments in event contributions
- Click the blue link in the warning message to go directly to the area where the issue can be fixed
💡 Good to Know: Dashboard warnings help you find setup or payment issues before they impact your event
Event Analytics
The Event Analytics section provides a quick snapshot of your event's performance, including fundraising, bidding, ticketing, sponsorships, and payments collected.

- Current Fundraising Total: Displays the total amount raised for the event to this date and time.
- When clicking the icon the popup will show the Fundraising Total breakdown.

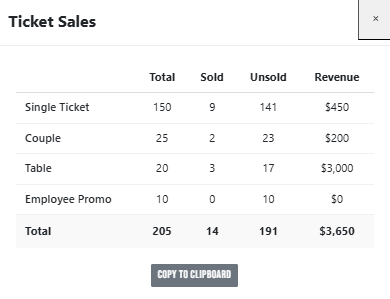
- Reservation Revenue: Displays revenue generated from reservations or ticket sales.
-
When clicking the icon the popup will show the Reservation sales breakdown
-
- Registered Bidders: Displays the number of guests who have completed the registration form on the event site. **This only shows if you are using mobile bidding
- When clicking the icon the popup will show the Registered Bidder Breakdown.


- Sponsorship Revenue: Displays revenue generated from sponsorship sales.
- When clicking the icon the popup will show the sponsorship sales breakdown.

- Total Bids: Displays the total number of bids placed across all auction items.
- Helps track bidding activity throughout the event.
- When clicking the icon the popup will show the bidder and bidding breakdown.

- Ticketed Guests: Displays the number of guests with reservations or tickets.
- If using event check-in, this metric will also display the number of guests who have checked in.
- When clicking the icon the popup will show the Guest count breakdown.

- Funds Collected: Displays the amount of money that has already been collected.
- The breakdown separates Event and Pre-Event collections.
- When clicking the icon the popup will show payment type breakdown.

💡 Good to Know:
- Guests do not need a credit card on file to be counted as a registered bidder.
- These can be helpful when providing quick financial updates during your event.
- If bidding activity is low or not increasing, consider promoting auction items to encourage participation.
- In any of the popup analytics boxes you can click on copy to your clipboard to be used in other reporting purposes.
Donation Total

- Shows the total dollar amount donated for the whole event
- breaks it down by:
- Pre-event donations
- Donation levels
- Number of donors at each level
💡 Good to Know: If two donors give at the $250 level, the count will display under the $250 donation level
Auction Total

- Shows the total auction amount so far, this is up to the minute
- Includes:
- Leading bids
- Winning bids
- Buy Now purchases
- Also breaks totals down by auction type
💡 Good to Know: Auction totals update in real time as bidding activity changes
Item Sales Total

- Shows the total dollar amount for Items for Sale
- Also breaks down totals by individual item
- Raffle levels are included under the main raffle ticket total
Auction Items Circle Graph

- Shows overall auction item activity
- The number in the center shows total auction items available
- The graph rim shows activity in real time:
- Main color = items with active bids
- Secondary color = sold items
- Gray = items with no bids
- Hover over the colored sections to see how many items are in each section
💡 Good to Know: This graph helps identify items that may need extra attention or promotion before closing
Printable Quick Help Guide:
(see below for printing instructions)

How to Print This Guide
- Right-click on the image of the guide
- Select Save Image As…
- Save the file to your computer
- Open the saved image
- Click Print (or use Ctrl + P / Command + P)
💡 Good to Know
For best results, print using Full Page or Fit to Page settings to ensure proper sizing and clarity.